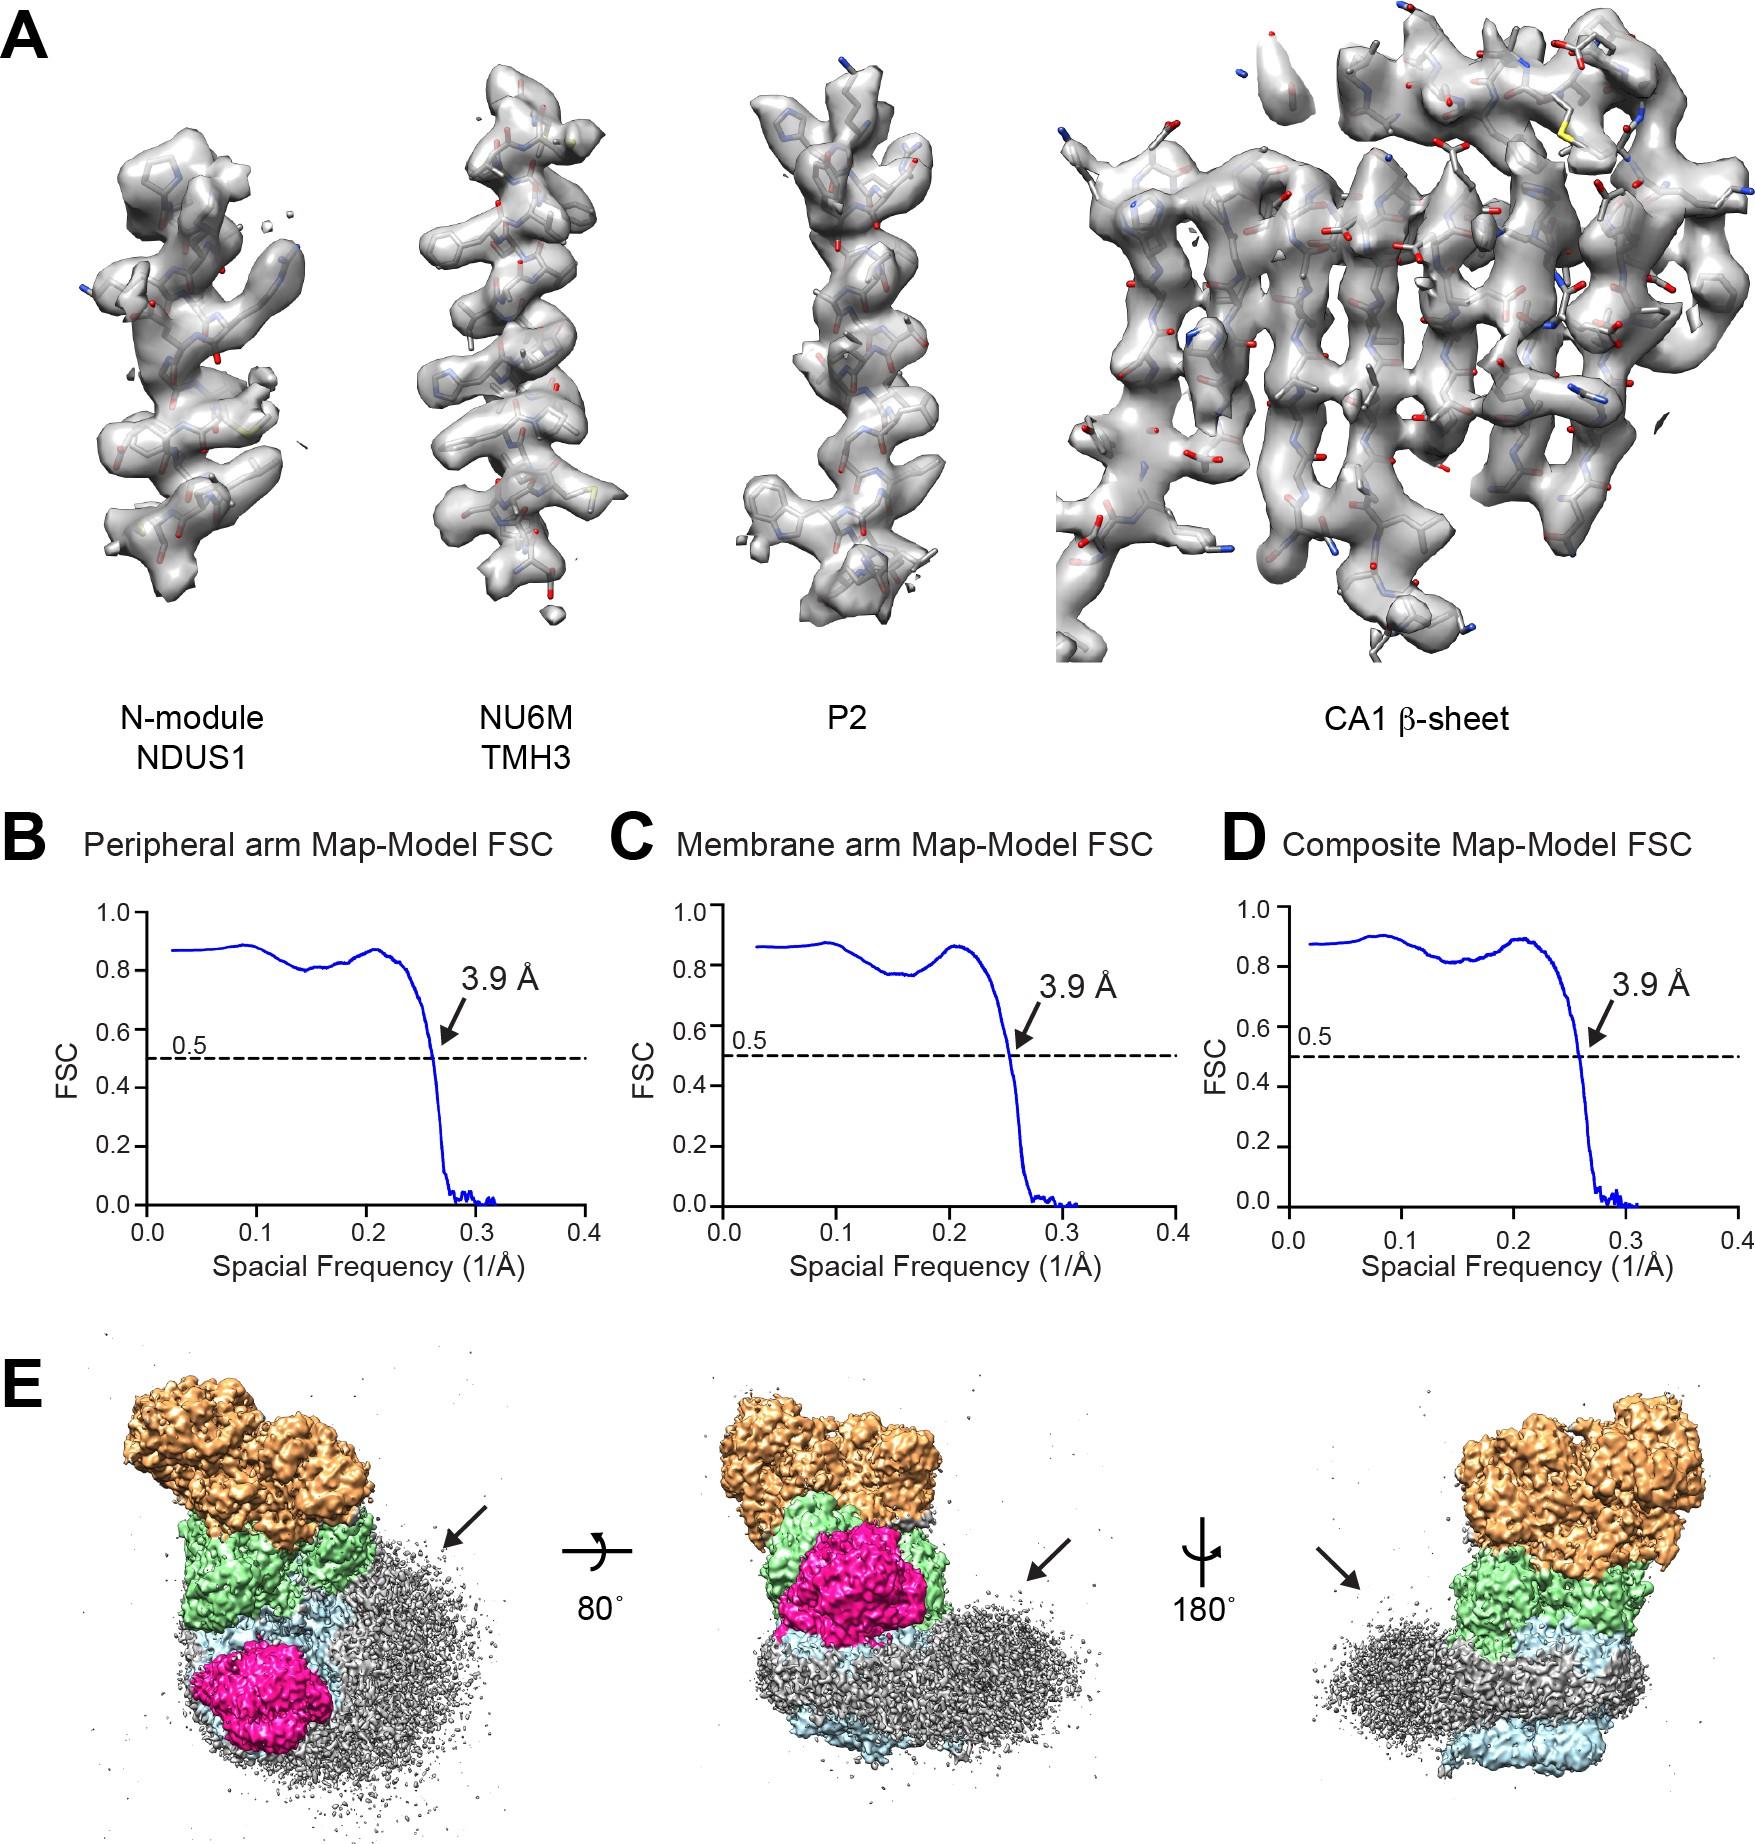
CryoEM model-to-map correlation.
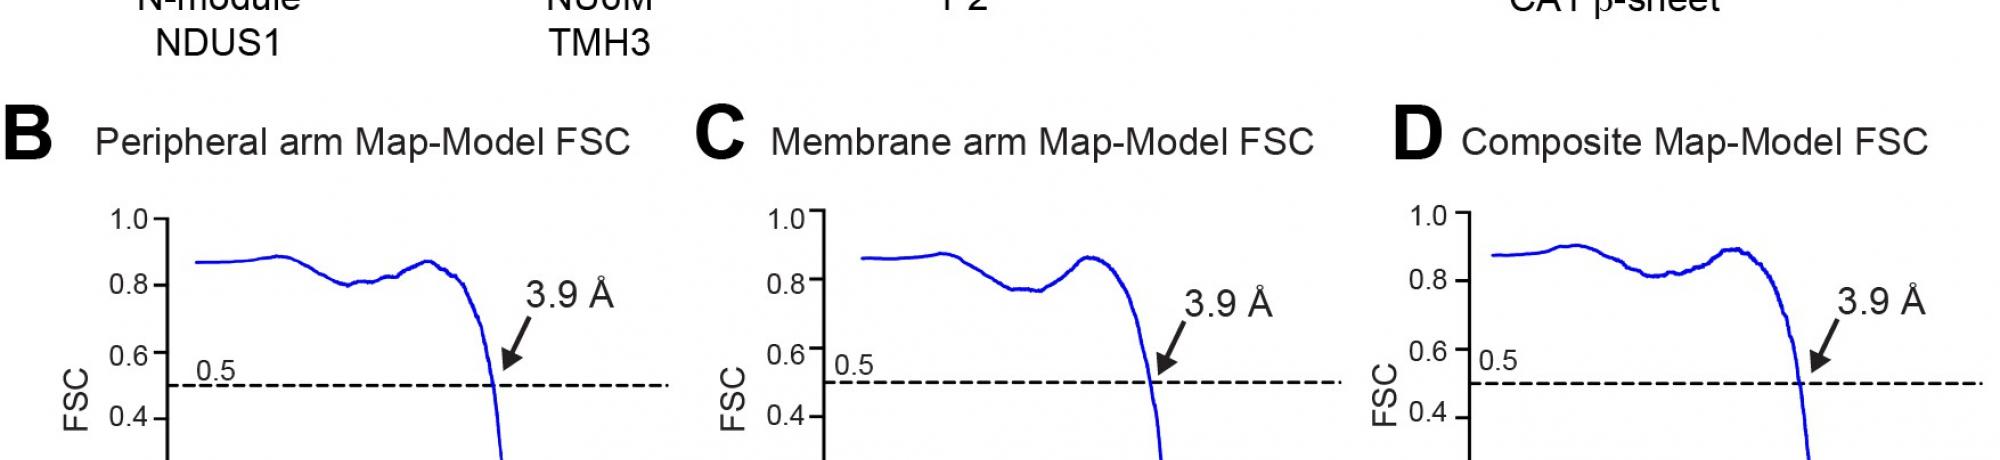
(A) Representative density from the composite map showing the fit between the model and thee map for elements of secondary structure from the peripheral and membrane arms of CI*. (B–D) Map-Model FSC curves are shown for the peripheral arm focused refinement (B), the membrane arm focused refinement (C) and the composite map (D). (E) Low contour of filtered cryoEM density for CI* colored by module (N, tan; Q, green; PP blue; and γCA pink). The lipid membrane density is shown in grey.
Photo(s)